
Intern Reed C McDonough – freshman Meteorology and Broadcast Journalism major working under Dr. Shuyi Chen at the University of Miami’s Rosenstiel School.
Entry 2:
It is now late June, and I am about halfway through my summer project. For the past six weeks, I’ve been collecting OSCAT satellite wind speed data and comparing it with the UMCM-WMH wind speed forecast model (University of Miami Coupled Model). To do so, I have been using MATLAB to organize data into different types of plots that are all useful for comparing forecasts to observed conditions. MATLAB can be very tricky and specific; and downright frustrating sometimes. However, at the end of the day, it is a vital tool that enables extremely large amounts of data to be computed and organized.
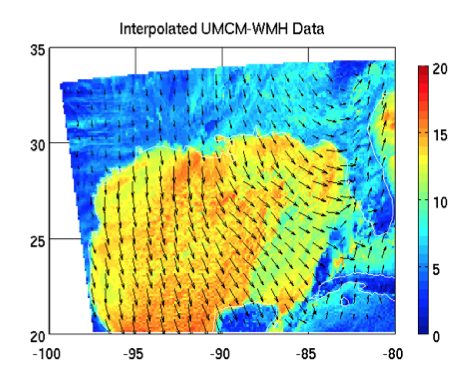
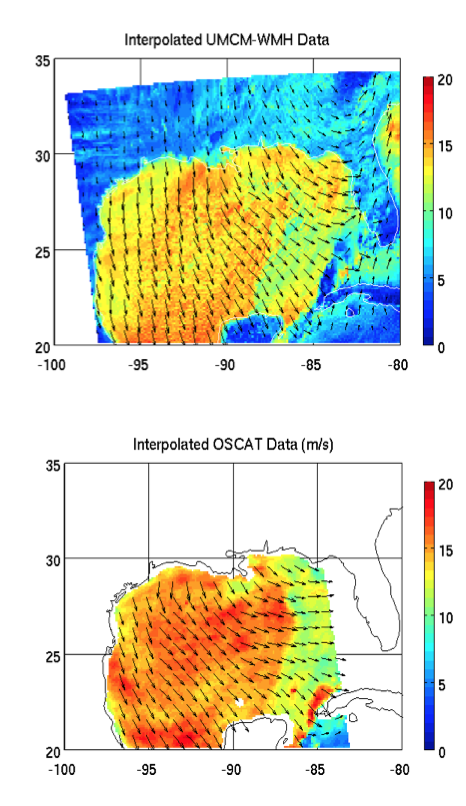 The image on the titled “Interpolated UMCM-WMH Data” represents the UMCM-WMH forecast for wind speed and direction at 06 UTC 27 November 2013. The image titled “Interpolated OSCAT Data (m/s)” represents the actual observed OSCAT wind speed and direction for the same time and date. In these images, we see that the OSCAT observed data shows a deeper red color throughout the Gulf of Mexico, indicated wind speeds of about 15 to 20 m/s. The model shows more yellows and lighter reds, thus telling us that it seems to have under-predicted wind speeds throughout the Gulf of Mexico.
One way to prove this is to compare forecasts and observed data by subtracting the OSCAT
observed data from the model forecast data which reveals any bias, or error. In subtracting this data, I created both a visual difference map titled “Difference Map of UMCM minus OSCAT” that reveals over-predictions and under-prediction and a scatter plot titled “Representation of the Accuracy of UMCM Model” which quantifies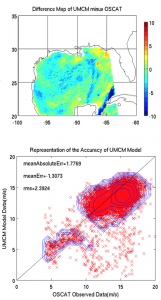 wind speed errors using three statistical values and visually indicates the data points that were either over-predicted or under-predicted. The lighter blue colors in the difference map indicate and under-prediction of about -1 to -4 m/s, which is confirmed by the meanErr value in the scatter plot of -1.3073.
In the coming weeks, I will work on comparing the accuracy of UMCM-WMH wind vectors, and examine rain fall for the duration of the SCOPE and GLAD experiments. Then I will start organizing everything into a final report, which I’m sure will need lots of editing and revision! Back to work!
Reed C McDonough